Thermal conditions in Poland 2011-2020 – the warmest decade in 70 years
The Institute of Meteorology and Water Management- National Research Institute has been monitoring Poland's climate for over 100 years on an ongoing basis, conducting observations and measurements of all relevant climatic variables. We inform society and public administration bodies about the climate system's condition and the dangers resulting from climate variability and change.
The publication aims to present the Polish climate's current state, with particular emphasis on the last decade (2011-2020). The presented analysis scope covers mainly air temperature (both in the context of average values and occurring extremes).
Air temperature
The multi-annual (1951-2020) variability of air temperature in Poland, both for the entire country and on a regional scale, was analysed. Over the last decade, each year, the average annual air temperature in Poland was above the long-term average (1981-2010), and as many as five years (2014, 2015, 2018, 2019 and 2020) can be characterised as extremely warm. 2019 was the warmest year since 1951, with an average air temperature of 10.2°C. Over the last 20 years, only in 2010, the average annual air temperature was lower than the multi-year average. The current rate of change in Poland's area average air temperature is 0.29°C/10 years (for the period 1951-2020). And the difference in the average annual air temperature between decades 2001-2010 and 2011-2020 is over 1°C (the averages were 8.22°C and 9.33°C, respectively).

What's next
Monitoring of climate variability is only one element of the activities. It allows for the identification of current directions of changes. In combination with the analysis of climate change projections, it will enable mitigation (limiting our impact by reducing greenhouse gas emissions) and adaptation measures (e.g. MPA44). Together, they will serve as a foundation for our civilisation's conscious adaptation to the expected climate change.
The climate is a natural resource that has a significant impact on civilisation. Modern climate change that has been observed for around 170 years is a consequence of human activity, undoubtedly takes magnitudes that had not been observed before on Earth since the human species inhabited it. This exceptionality is linked to the pace of change as it has never before been happening so quickly. Moreover, never before has any climate change threatened such a large human population. It makes ongoing monitoring of climate a necessary measure. The same applies to the mitigation actions slowing or even eliminating the causes of recent climate change, forecasting the future evolution of climate system, and developing relevant adaptation strategies.
Central Europe is not an exception. Observed changes more frequently directly influence the economy and human physiology, resulting in a direct threat to life (e.g. heat waves). For example, it is estimated that the heatwave in Europe in 2003 caused 30,000 deaths. The costs to the economy from energy supply constraints, transport restrictions and reduced agricultural production amounted to EUR 13 billion (UNEP, 2004).
The publication aims to present the Polish climate's current state, with particular emphasis on the last decade (2011-2020). The presented analyses' scope covers thermal characteristics both in the context of average values and recorded extremes. The text was based on materials prepared by specialists of IMGW-PIB and published as the report Climate Poland 2020 (IMGW, 2021) and additional analyses based on the results of meteorological measurements.
A detailed description of the variability of thermal characteristics in Poland in the last 70 years is beyond this contribution's scope; therefore, it was decided to present this variability's general features using the area average. The area average air temperature is an indicator that allows describing the thermal conditions synthetically in a given area. It allows comparison between regions and provides the reference point to values determinating temperature on the regional or global scale. For this purpose, temperature values are calculated for the basic physio-geographical units of Poland. They are (from the north): the Coastal Belt and the Southern-Baltic Coastlands, the lake districts belt, lowlands belt, the uplands belt, the Podkarpacie, the Carpathians, and the Sudetes. In addition, to reflect the impact of the Atlantic Ocean's and the Asian continent, the lowlands and the lake district belts were divided into western and eastern parts along the 19°E meridian. Such a division allows showing possible differences related to the thermal regionalisation of Poland. Descriptive classifications are often used to determine to what extent thermal conditions of the month, the climatic season, or the year differed from the typical conditions. One such qualification is based on an empirical cumulative distribution function of average air temperature values for each month, season, or year in the normal period 1981-2010, allowing the determination of the classes' threshold values based on a certain probability. Each class is given a descriptive name (Fig. 1). Based on such a classification, the figures below show the long-term variability of thermal conditions in Poland.


Fig. 1. Thermal classification of area average air temperature in Poland 1951-2020
The last decade (2011-2020) stands out in the average air temperature values course (Fig. 1). 2019 was the warmest year since 1951 (Fig. 2) and probably the warmest in the period of instrumental measurements since at least 1850. The average annual air temperature in 2019 exceeded 10.0°C and amounted to 10.2°C. It was almost 2°C higher than the long-term norm (1981-2010). In 2020, the temperature was only slightly lower and amounted to 9.9°C. All years of the last decade were warmer than the long-term average, and as many as five of them can be classified as extremely warm, i.e. those when the value of the average annual air temperature was higher than the threshold value with a 5% exceedance probability.
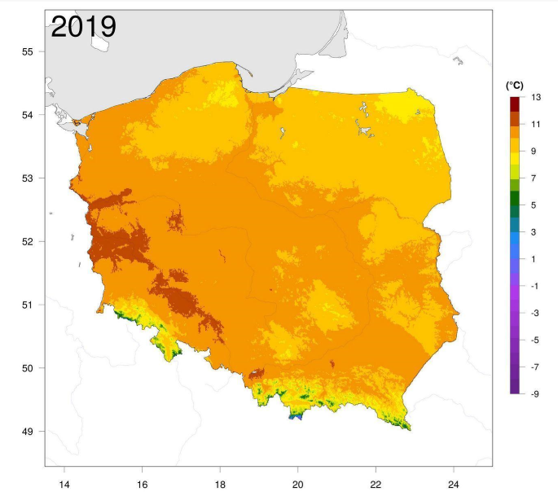
2019 (the warmest year since the mid-20th century) was extremely warm (Fig. 2). The warmest region of the country was the area between Zielona Góra, Słubice and Gorzów Wielkopolski. The Silesian Lowland also stood out. The values of the average annual air temperature exceeded 12°C there. The coldest area was located (apart from the higher parts of the Sudetes and the Carpathians) in north-eastern Poland near Suwałki. Still, even there, the average annual air temperature was close to 9°C. The highest air temperature value (38.3°C) in 2019 was recorded at the Ceber station on June 26 and 28. The lowest (-24.0°C) occurred in Poronin on January 23. Due to the fact that the winter months were extremely warm, the air temperature in winter, i.e. in the period December 2019-February 2020, was 3.1°C and was as much as 3.9°C higher than the climatic norm. It was the warmest winter since the mid-twentieth century and since the beginning of instrumental measurements in Poland.


Fig. 2. Average annual air temperature in Poland in 2019.
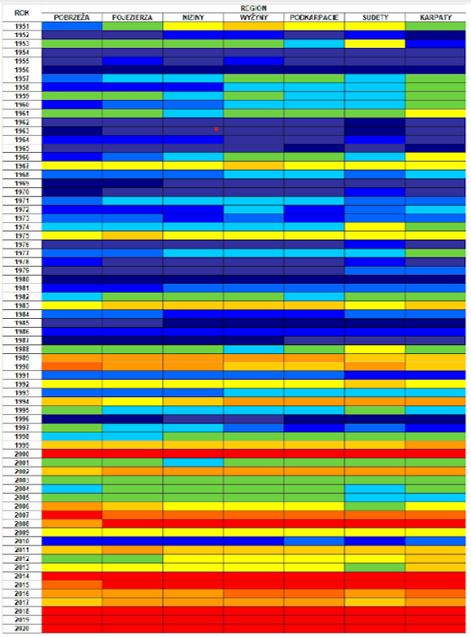
Fig. 4. Regional thermal classification in Poland 1951-2020 (legend as in Fig. 1)
The average air temperature in Poland since 1951 has increased by slightly more than 2.0 ° C. In the lake district and the lowlands. In Podkarpacie and the Carpathians, the air temperature has risen by 2.1°C over the last 70 years. The slowest pace of temperature increase is in the Sudetes (1.8°C). Since the beginning of the second half of the 20th century, the temperature of winter has increased by 2.5°C and summer by 1.9°C.
In particular years, physio-geographic regions differ in terms of thermal conditions (Fig. 4). These differences are not significant; however, there are some differences in the analysed periods. There have been years when the regions' thermal conditions varied considerably (e.g. 1951, 1966 and 1997). The warming process is clearly visible. As you move along the timeline, warm colours replace cool colours. This change reflects the warming process that is taking place in all regions. The temperatures are rising! It is worth noting that the last six years (with slightly less intensity in 2016 and 2017) have been extremely or anomalously warm in most regions.

Table 1. Area average air temperature in Poland (°C) in selected decades 1951-2020
The average values of air temperature in the individual decades of the period 1951-2020 (Table 1) are between 7.1°C (more precisely 7.08°C in the 1961-1970 decade) and 9.3°C (more precisely 9.33°C, in the last decade 2011-2020). The table showing these values shows the progressive increase in air temperature from decade to decade. The situation is similar in the case of normal periods (30 years). The increase is unambiguous, from 7.2°C in 1951-1980 to 8.7°C for the last 30-year period. As mentioned before, the last 20 years is the warmest period since the half of the 20th century.

Table 2. Seasonal average air temperature in Poland (2000-2020). The highest values have been highlighted in red.
As already mentioned, the warmest winter (December-February) in the analysed period occurred in 2020 with an average temperature of 3.1°C (Tab. 2). The warmest spring (March-May) was in 2007 (10.0°C), the warmest summer (June-August) in 2019 (19.9°C), and the warmest autumn (September-November) in 2006 (11.0°C). Regarding annual averages, the warmest year was in 2019 (10.2°C). In the last 20 years, only in 2010, the average annual air temperature was lower than the long-term average value for the period 1981-2010. The anomaly was -0.8°C and was a consequence of the extremely cold beginning of the year (January-February) and cold December 2009.

Table 3. Average decadal air temperatures at selected synoptic stations in Poland (1951-2020)
Progressive warming is also visible at individual meteorological stations, located in Poland's various physio-geographical regions (Tab. 3), characterised by different location features (coast station, metropolitan station, mountain station, small town).

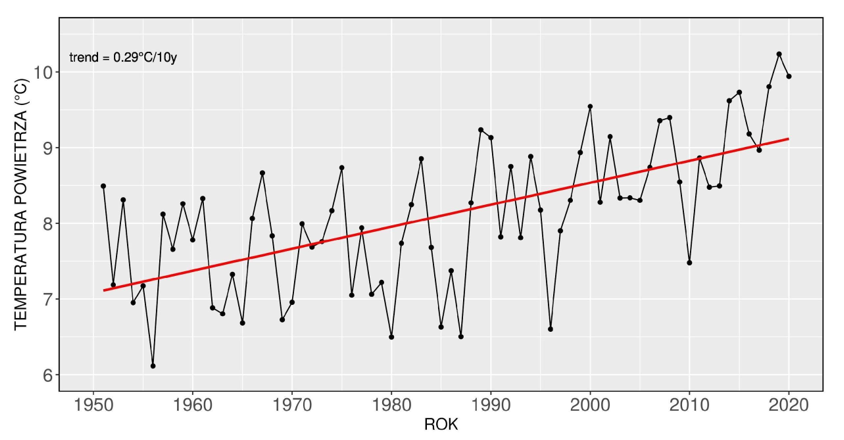
Fig. 5. The course of the annual area average air temperature in Poland (°C) 1951-2020.
The increase in the average annual air temperature in 1951-2020 is characterised by a positive, statistically significant (at 0.05 level) trend, amounting to 0.29°C/10 years. This corresponds to a temperature increase in the given period from 1951 by as much as 2.0°C. When analysing the regional variability of the air temperature trend coefficients, one can say that this variation is small. The coefficients' values range from 0.26°C/10 years (Sudetes) to 0.30°C/ 10 years for most regions. Slightly lower values occur in the highlands (0.27°C/10 years) and the coastal areas (0.29°C/10 years).
So far, the analysis concerned average values of air temperature. From the point of view of society, the periods when the air temperature reaches very high values are equally important. In the last few decades, we have had several severe episodes of heatwaves in Europe (e.g. in 2003, 2010, 2019).

Fig. 6. Exceedance probability of maximum daily air temperature. Maximum recorded values of air temperature at synoptic stations are shown as labels. June 2019.
Over the last decade, June 2019 has definitely stood out in Central Europe. In terms of thermal characteristics, June 2019 was much above the normal throughout the country. It was the warmest in Greater Poland, in the Lubuskie Land and Mazowsze. The highest positive anomaly (+7.0°C) occurred in Poznań, and the smallest: +4.2°C for the station in Kołobrzeg. The highest daily air temperature: 38.0°C, was recorded on June 26 in Poznań (this applies to synoptic stations). However, it should be emphasised that on June 26 in Radzyń (at the climatic station), a temperature of 38.2°C was recorded. It was the highest air temperature recorded in June in the years 1951-2019 in Poland.
In the analysis of extreme temperatures, one can use the approach involving the calculation of the exceedance probability of a specific temperature value (using fitted theoretical distributions). This enables drawing a map, which synthetically allows determining the "extremity" of a month in scope. In June 2019 (Fig. 6), the probability is close to zero throughout the country, which clearly indicates the extreme nature of the recorded air temperature values.
The climate of Poland is changing in concordance with trends observed on a regional scale. This is a fact none can reasonably argue with. The expected changes on the scale of the 21st century will undoubtedly result in the intensification of the occurrence and magnitude of heatwaves. In fact, every year, new "records" of temperatures recorded over the years are exceeded. What can we do? In addition to taking mitigation measures to limit the impact of our activities on the climate by reducing emissions, we must consciously engage in adaptation schemes that, in the long term, will allow the economy and local communities to adapt to the inevitable changes. An example of such activities is the MPA44 project (http://44mpa.pl/) implemented by IMGW-PIB in cooperation with other scientific institutions. It allowed for the assessment of the sensitivity of the largest cities in Poland (over 100,000 inhabitants) to climate change and the preparation of individualised urban adaptation plans for Poland's largest cities.
Authors: Mirosław Miętus, Michał Marosz - Institute of Meteorology and Water Management – National Research Institute
References:
IMGW, 2021, Klimat Polski 2020, IMGW-PIB, Warszawa, URL: https://www.imgw.pl/badania-nauka/klimat
MPA44, Opracowanie planów adaptacji do zmian klimatu w miastach powyżej 100 tys. Mieszkańców, URL: http://44mpa.pl/
UNEP. 2004, Impacts of summer 2003 heat wave in Europe, Environment Alert Bulletin, UNEP-GRID , URL: https://www.unisdr.org/files/1145_ewheatwave.en.pdf


